
Our methodology consisted primarily of using Google SketchUp to develop the 3D model of downtown Lockhart. This process required the greatest amount of time, and incorporated our photographic data and aerial imagery to generate this accurate representation.
3.1 Data Collection and Preprocessing
During this phase of the project, D3GVS collected photographic imagery, from the ground and the air, of the nine square blocks in the downtown area. To organize the process, we numbered the building footprints of each building using a numbering system based on the block and number of buildings. While taking pictures, we recorded attribute information regarding the number of floors of each building, business type, and address. Images of each building were then divided into separate folders and uploaded to Microsoft Photosynth. Microsoft Photosynth is a free, online tool that allows users to upload pictures of an object to relate the pictures to one another in three-dimensional space. The result is a three-dimensional point cloud dataset that can be downloaded from Microsoft’s server. The preprocessing phase of the project involved using these point cloud datasets to take measurements of buildings.
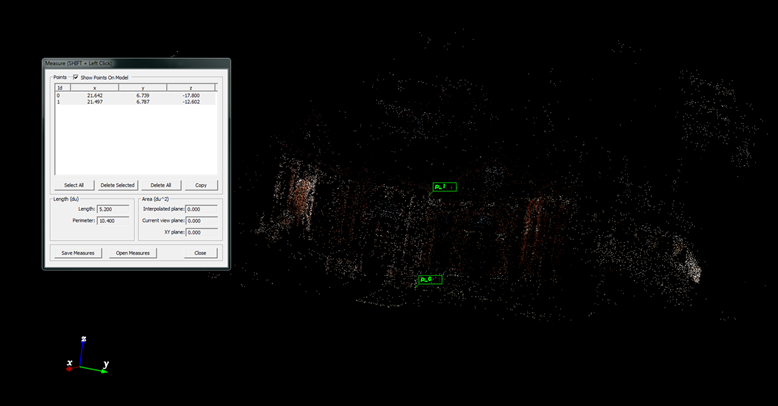
The point cloud data are referenced based on an arbitrary coordinate system that is determined by Photosynth, so measurements between two points would yield an arbitrary number based on this coordinate system. To solve this issue, we imported the point clouds into ScanView and took measurements of wall heights. Using an arbitrary height of 11 feet per floor and the ratio between this arbitrary measurement and the one from ScanView, we were able to measure the length, width, and overall height of each building. These measurements were checked against measurements from the Lockhart aerial image using ESRI ArcMap, and were found to be quite accurate. These measurements were then used to create the base models for each building in Google SketchUp. We ended the Preprocessing phase of the project by filling in the attribute table for the building footprint shapefile.
3.2 3D Modeling
 |
.png) |
 |
 |
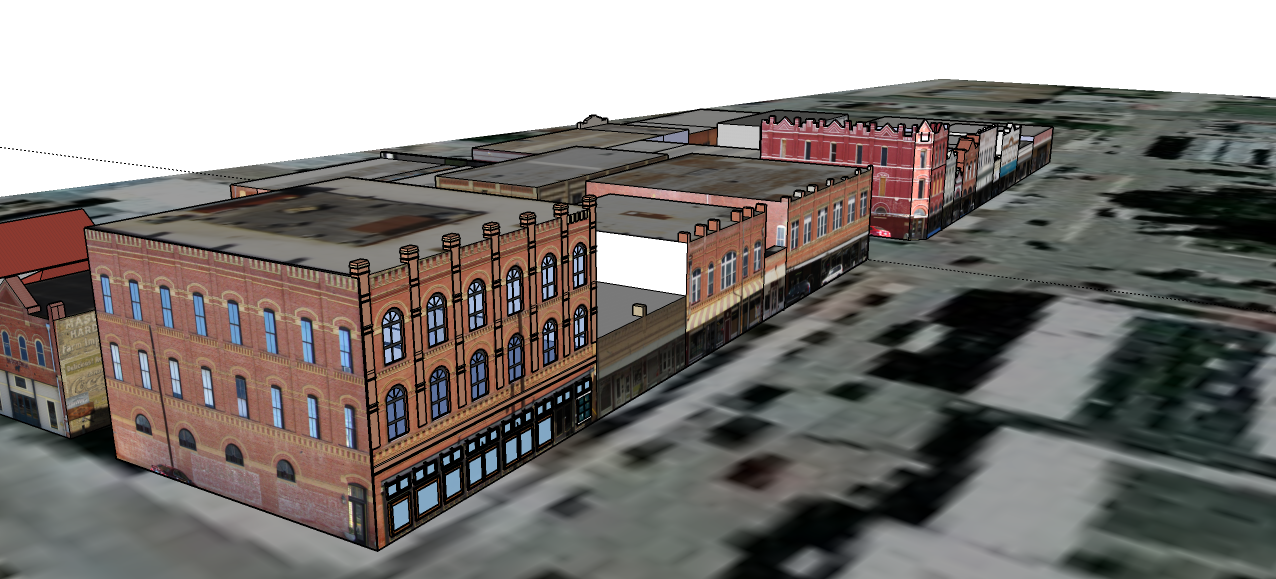
This phase of the project was the most intensive one. First we divided the blocks into sections for each team member to work on. In Google SketchUp, we imported a georeferenced aerial photo from Google Earth to provide the locational data for our models. Using the measurements we derived from ScanView, we traced building footprints in their proper locations and extruded the heights to their proper measurements. We then added our digital photographs to the models to serve as a base layer for adding building details such as awnings, windows, etc. In instances where an obstruction was stamped onto the side of a building, we used textures from SketchUp along with our own unique photo textures to fill in that area.
We chose to use Google SketchUp as the primary method for completing this project because it is a free CAD program which produces models that can be easily integrated with Google Earth. Our goal for this project was not only to develop an accurate 3D model, but to complete the task using easily accessible tools so that City of Lockhart employees may have the opportunity to build upon the model in the future. Not only can SketchUp be downloaded for free from Google’s website, but there are countless tutorial videos available on the web that are beneficial for SketchUp artists of all skill levels. While the learning curve proved to be somewhat steep at first, the widespread availability and use of SketchUp make it, likely, the most practical approach to 3D model production.
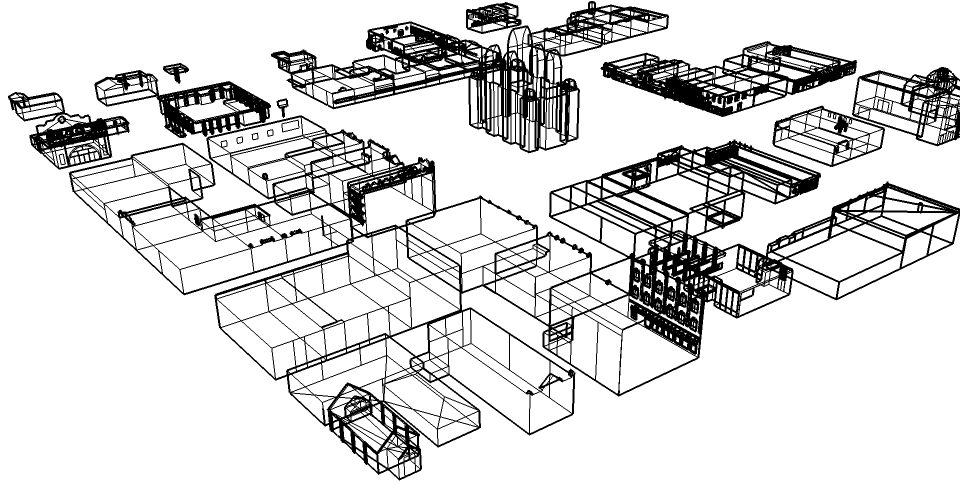
Google SketchUp was not the only modeling application we tested. We experimented with 3D model development using point cloud data from Microsoft Photosynth. Using Henri Astre’s Photosynth Toolkit with PMVS2, we were able to successfully post-process point cloud data from Photosynth to create super-dense point cloud datasets. The result was a .ply file that can be manipulated and built upon using MeshLab, and open-source software application used for modeling 3D meshes. Using MeshLab, a wireframe mesh can be developed from the point cloud data, effectively creating a solid 3D model of the subject of the photographs.
Though we were unable to derive a dense point cloud from the ground photos, the aerial photos produced an incredibly dense cloud for a few square blocks that was used to create a high quality wireframe mesh. Unfortunately, this is one of the limitations of this methodology, as it is nearly impossible to develop a ‘water-tight’ model from pictures taken from the ground. Also, the post-processing method requires a large amount of computing power, high speed processors and lots of ram. On a standard personal computer, using the Henri Astre’s Photosynth Toolkit will simply cause the computer to crash. The number of technical difficulties associated with point cloud model development made it unfeasible for our project and for future use by the City of Lockhart.
3.3 Web Development
The benefit of using free Google applications are that the software a free, and relatively simple to use. To develop the web application that was requested by the City of Lockhart, we used Google My Maps, part of the standard Google Maps. My Maps provides the opportunity for the user to place and edit place markers and edit their attribute information however they wish. Then, by simply pasting a link for the map into the Google Embed KML Gadget, a personalized web application is developed. Once the application is developed the script can be posted onto a web page and displayed instantly. Editing the Google My Map associated with that web application will update the application as well. Currently the 3D buildings that were developed by D3GVS are not yet viewable in the web application. However, they have been submitted for review to Google and will be displayed on the web app once accepted.
|
|
|---|