A Watershed Vulnerability Analysis for Travis County and Areas of Influence
Summary
The City of Austin Fire Department: Wildfire Division (AFDWD) has created numerous amounts of vulnerability analysis looking at areas that are vulnerable to wildfires, but they have never looked at what watersheds are vulnerable to degrading the water quality from a wildfire event. This creates a major need for a spatial analysis to be done so that the AFDWD can determine how to mitigate fire control to protect the watersheds that are at most high risk. This study was done by Inferno Analytics and looked at all of Travis county and parts of Hays, Bastrop, Blanco, Burnet, and Caldwell counties that have watersheds that flow into the Travis county boundaries. Our final spatial analysis will show the watersheds ranked from watersheds of high risk to low risk and also a separate cost distance analysis will be conducted to aid the AFDWD in showing which areas in our study area are more difficult to get to from a fire station because of the terrain. This report will help aid decision makers when it comes to what methods to use to put out fires because of the risk of pollutants getting into the water. Then our online story map can be used by the general public so that they can get involved and see which watersheds are at risk to protect their water supply.
Purpose
The purpose of this project is to create a watershed vulnerability index for the use of The City of Austin Fire Department: Wildfire Division (AFDWD) and for the view of the general public. This analysis will highlight which watersheds are most at risk to water quality degradation to help the AFDWD with mitigation to better protect those areas at high risk. We will also generate a cost distance analysis to highlight areas that are harder to get to from fire stations based off the landcover.
Methods
We ran a weighted product suitability analysis and a cost distance analysis for this project. For all our analysis we used North American Datum 1983 Universal Transverse Mercator 14 North, U.S. meters. We weighted our variables (slope, biomass, and soil) for the vulnerability index based off the factors risk of moving debris into the watersheds. Once the weighted sum’s analysis was displayed on the map, we took the sum of each watershed’s risk points and standardized the data by dividing by the area of the watershed to give us our rank value for the vulnerability index.
Conclusion
We found that the areas in West Austin mainly around West Lake hills and Bull Creek are the most vulnerable to have water quality issues from debris getting into the watersheds. Our analysis has displayed crucial information to help mitigate fire response and fire prevention. The general public can also benefit from this study to understand what watersheds are at high risk and that individual need to be cautious of dumping debris and burning brush.
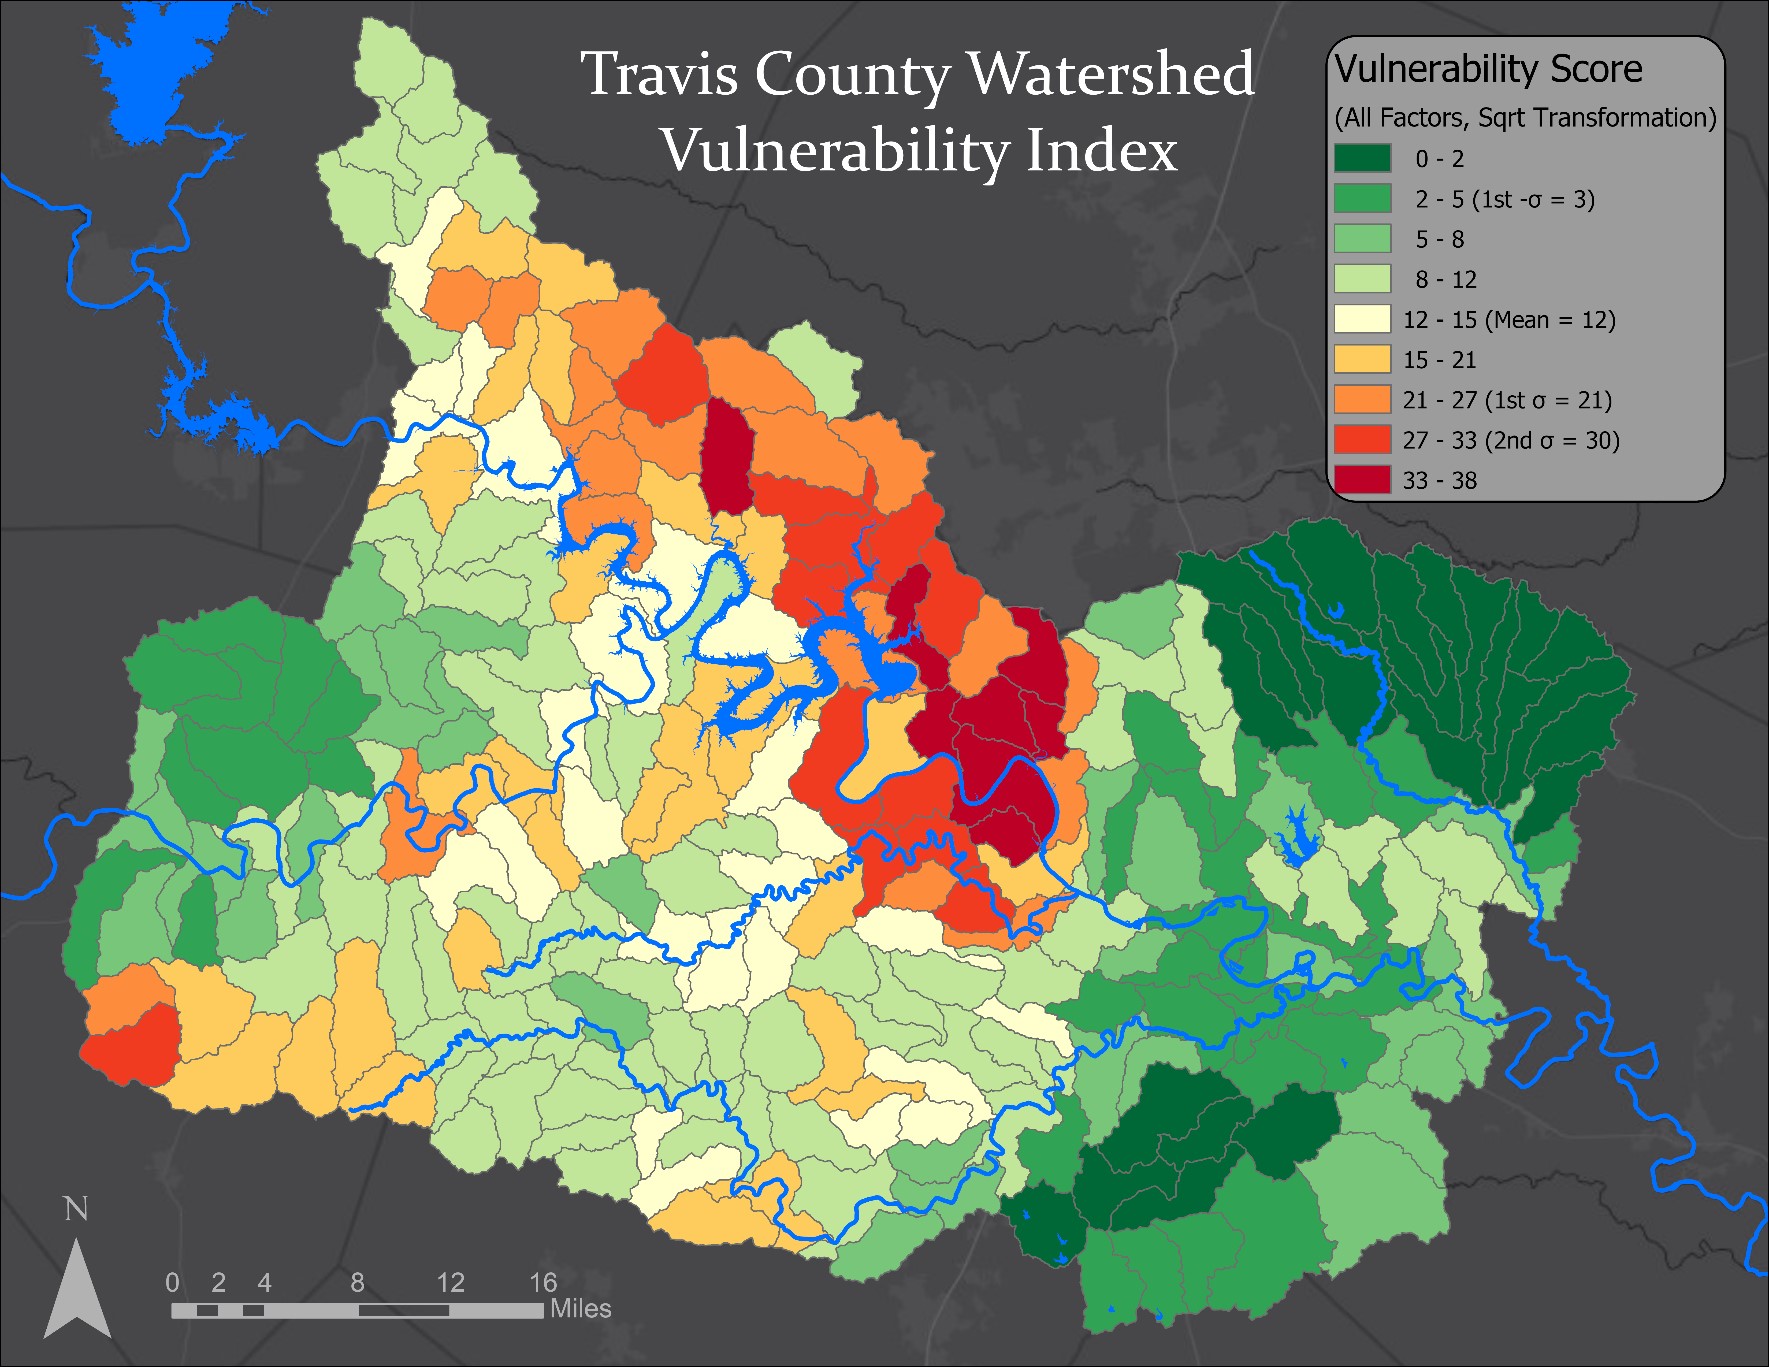
Watershed Vulnerability Index