Utilizing the best mapping software
Construction on the Edwards aquifer

Creating Maps

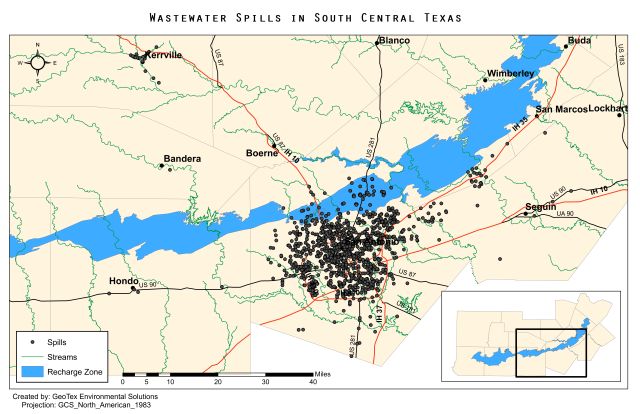
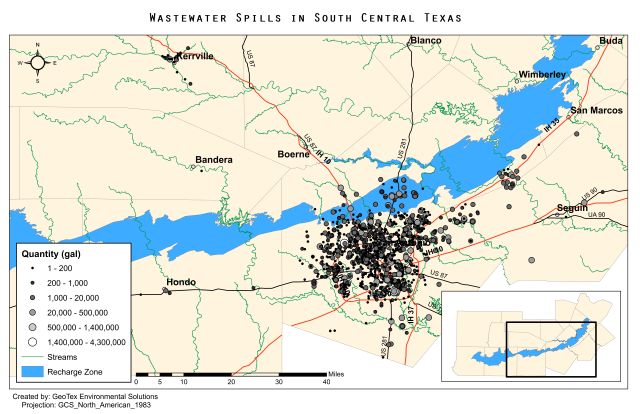
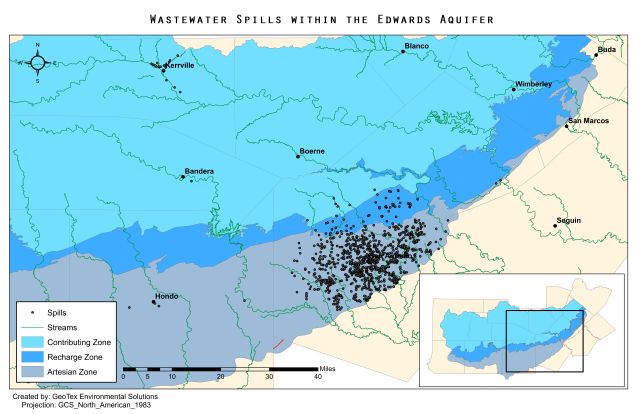
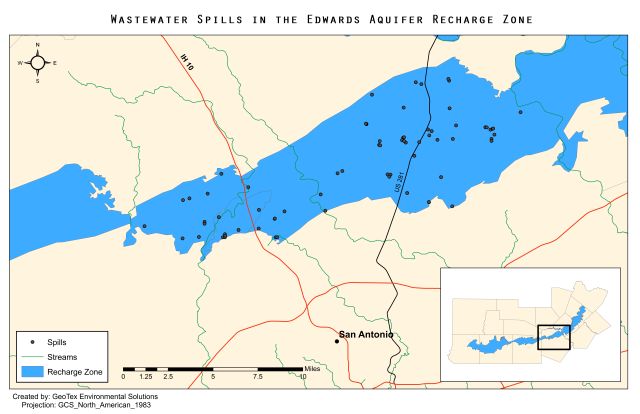
After analyzing the wastewater spill points acquired, GeoTex Environmental Solutions found that there were 83 spills ranging from 5 gallons to 150,000 gallons for a total of 809,000 gallons which occurred in the recharge zone of the Edwards Aquifer, and 1,688 spills ranging from 1 gallon to 4,216,000 gallons over the entire region of South Central Texas.

1. Wastewater Spills in South Central Texas

2. Wastewater Spills in South Central Texas - Graduated

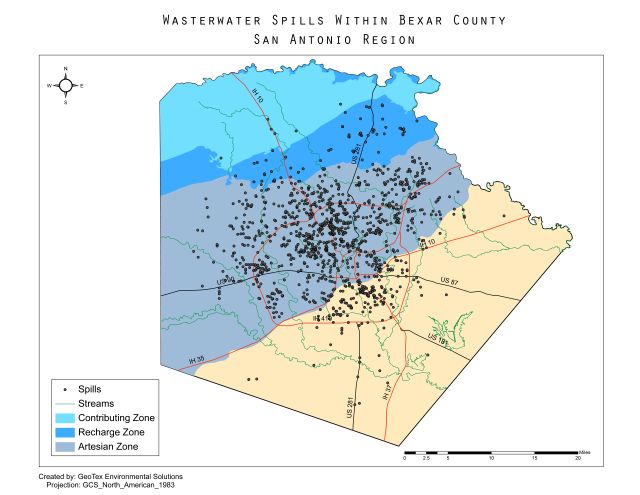
 3. Wastewater Spills in Bexar County, Texas

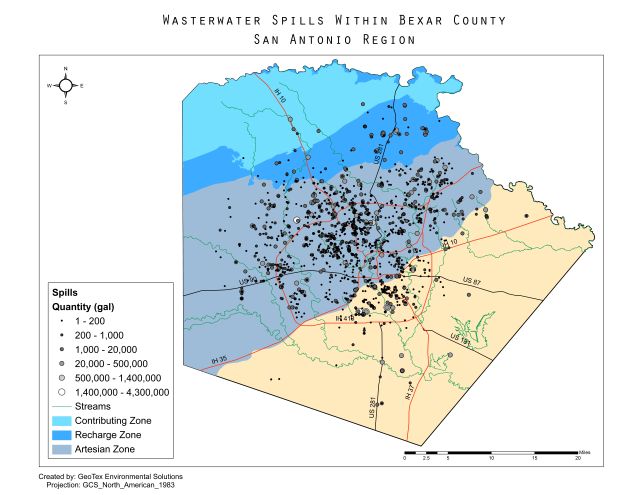
4. Wastewater Spills in Bexar County, Texas - Graduated

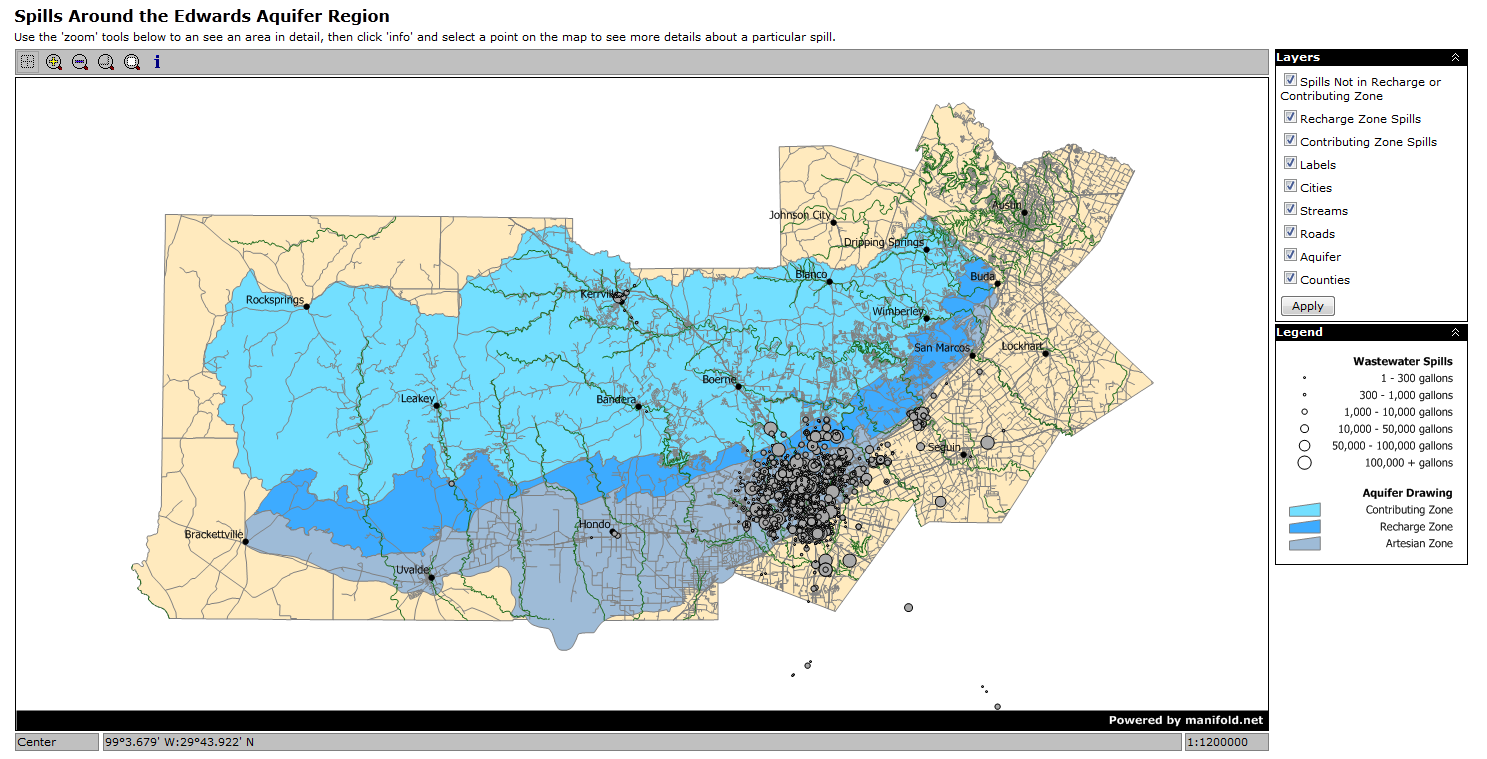
5. Wastewater Spills in the Edwards Aquifer - Graduated

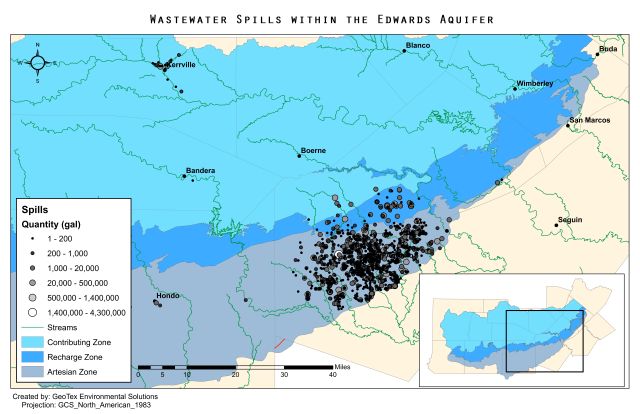
6. Wastewater Spills in the Edwards Aquifer

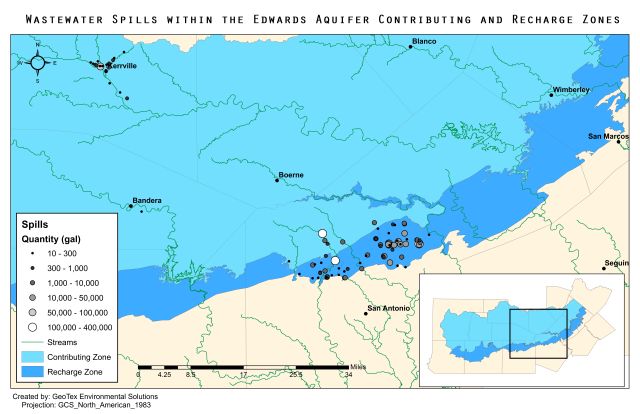
7. Wastewater Spills In Recharge and Contributing Zones - Graduated

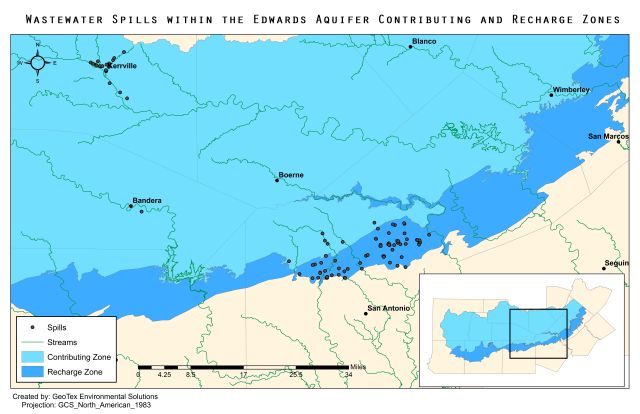
8. Wastewater Spills In Recharge and Contributing Zones

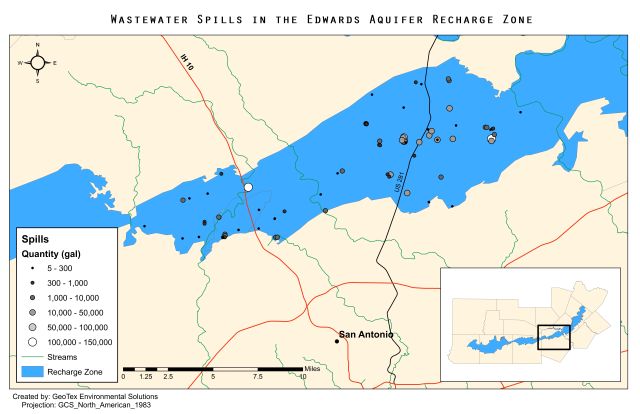
9. Wastewater Spills In Recharge Zone - Graduated

10. Wastewater Spills In Recharge Zone

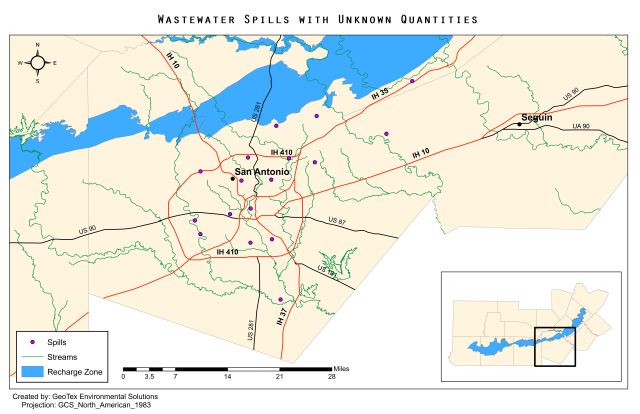
11. Wastewater Spills Unknown Quanties

Creating an interactive map

Click on image below to see our interactive map display wastewater spill data

Visit our interactive maps below or click on the image above

Interactive Wastewater Spill Map (with all spill & all roads)

Interactive Wastewater Spill Map (with all spills & only major roads)

Interactive Wastewater Spill Map (with only recharge and contributing zone spills & all roads)

Interactive Wastewater Spill Map (with only recharge and contributing zone spills& only major roads)

A large objective of this project was to make our findings available to the public in order to heighten their awareness of the frequency, quantity, and proximity of wastewater spills in the Edwards Aquifer. To achieve this, GeoTex Environmental Solutions has created an interactive map using Manifold, a more economically viable option for mapping, which will be placed on the Greater Edwards Aquifer Alliance’s website for public access. Creating an interactive map was done by compiling all relevant data into one place. We used ArcGIS to combine all the layers needed into a simple map and database. This includes:

  • Edwards Aquifer layer (including contributing, recharge, and artesian zones)
  • Streams layer
  • Counties layers
  • Wastewater Spill Points
  • Roads layer

This interactive map includes queries for volume of spill, date of spill, the latitude and longitude which can be manipulated to fit the wants of the user. The Manifold map will be housed on our web-server at Texas State University.