G-Tech Consulting
Summary
The city of San Marcos is experiencing a stage of rapid expansion and population growth, making it crucial to understand how and where this change is occurring in the present and in the past in order to better predict what will happen in the future. For our study we focused on an area encompassing the four Heritage Neighborhoods Areas, Dunbar, East Guadalupe, Heritage and Victory Gardens. We tracked changes in Land to Improvement Ratios and Owner Occupancy in the Heritage Neighborhoods over a ten-year period between 2008 and 2017, displaying our results in a Story Map which allows users scroll through year by year to investigate changes in the areas that most interest them. We further analyzed LIR and occupancy trends by visualizing our quantitative data using maps and charts, granting a unique view of the changes occurring in the Heritage Neighborhoods which should prove insightful to future planners and policy makers.
Purpose
The purpose of this study is to create quantitative spatial data which will allow us to identify areas of stability and change in the San Marcos Heritage Neighborhoods area over the course of a ten-year period. Ideally, this information will aid in providing policymakers with valuable insight into areas more susceptible to change, giving them the tools they need to develop policy which can help the city develop responsibly, while maintaining the unique character of its Heritage Neighborhoods.
Methods
Because we were working with ten years’ worth of data, we began our study by automating some of the processes we wished to carry out in order to save considerable time and effort later. After the scripting for automation was complete we were able to quickly add attribute fields for LIR and owner occupancy to the original tabular data provided by the Hays County Appraisal District. We combined these updated tables with Shapefiles containing parcels for the city of San Marcos, allowing us to display our numeric data visually and put it into a geographic context. Next, we cleaned and processed the data to make it easier to display and analyze. Finally, with our data fully prepared for further use and analysis we began to prepare a story map to display our results, create static maps to highlight change between years, and scrutinize our data both statistically and visually to determine temporal trends in owner occupancy and LIR.
Conclusion
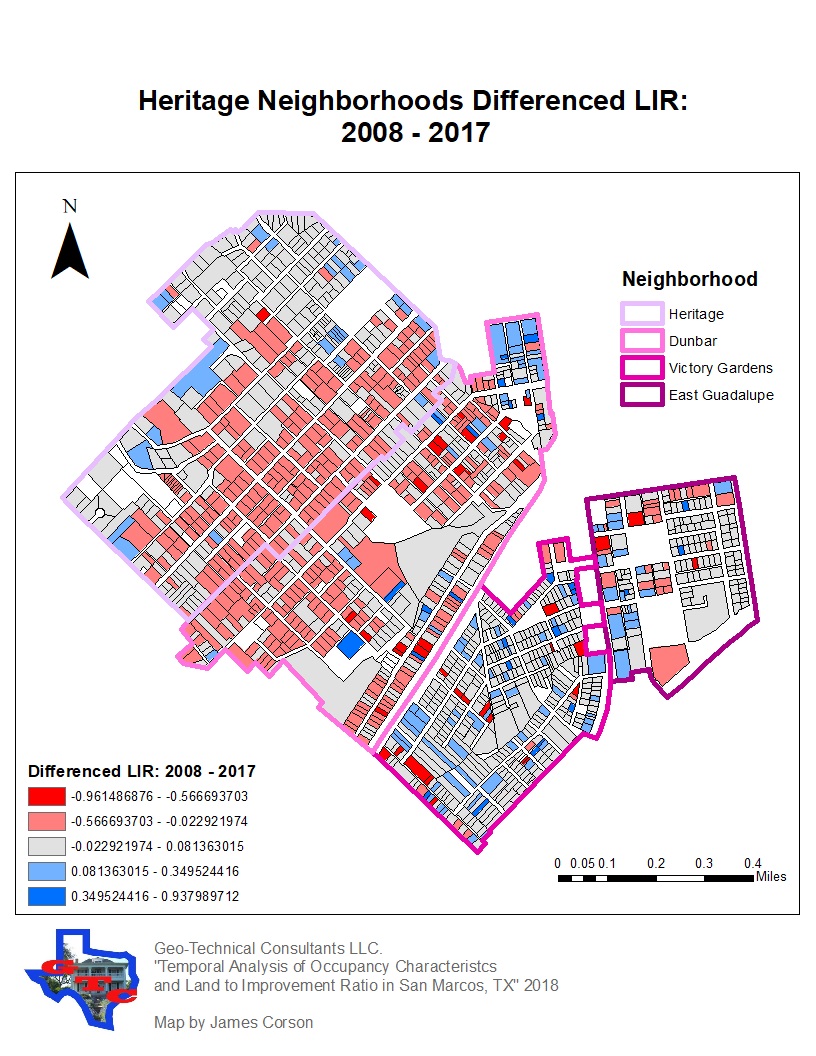
At the end of our project we found that the most stable neighborhood in our study area is the Heritage neighborhood, followed by Dunbar, while the least stable is victory gardens, which has experienced the most dramatic spikes and dips in its LIR and Occupancy status over the years. Three of the neighborhoods, Dunbar, East Guadalupe, and Victory Gardens, have relatively high LIR and low Occupancy rates in general, making them more susceptible to change and threatening their value as heritage properties. In contrast to the other neighborhoods, Heritage remains relatively stable, with low LIR and High occupancy between 2009 and 2017.For the future, emphasis should be placed on crafting public policy targeted at the Victory Gardens, Dunbar, and East Guadalupe neighborhoods, in order to better maintain stable property values and protect the historic value of these areas.

LIR Change 2008-2017