Background
An airport is a valuable asset to a local economy. Among the many great benefits of an airport, the areas surrounding them often experience increases in business productivity, tourism, and enthusiasm for aviation. In order for airports to operate efficiently, protect their traffic, and plan for future growth, it is essential that local and regional planning officials have access to detailed aviation planning information and tools. The Federal Aviation Administration (FAA) sets forth regulations that establish, among many other things, strict guidelines for creating civil airport imaginary surfaces. These surfaces create zones in which the height of objects within them must not penetrate the surfaces. Utilizing those regulations it is possible for aviation planning services to assist planning officials in their goals of regulating airport air space.
Purpose
The purpose of this aviation planning study is to provide the city of San Marcos with a newly adoptable airport hazard zoning map, and the tools and information that will help them protect and preserve the air space surrounding the San Marcos Municipal Airport. To create these products our team utilized Geographic Information Systems (GIS) and cartographic design techniques to design and plan our deliverables. The result of our work is an updated airport hazard zoning map and an interactive mapping tool useable by planning officials and, at the discretion of Texas Department of Transportation (TxDOT), the public.
Data
Our company looked through all sources of available data and narrowed it down to what we needed based on quality and accuracy. Data was collected or created for the San Marcos Municipal Hazard Zoning Map, the specialized GIS layers, and the interactive mapping tool. We projected all data used or created in this project using the North American Datum 83 (NAD 83) and in the State Plane Texas South Central (ft.) coordinate system. Some data had to be transformed from its original projection to adhere to the desired projection.
Due to the government shutdown of 2013, we did encounter some issues obtaining digital elevation models (DEM), of 10 meter resolution, from the United States Geological Survey (USGS). However, we were able to overcome this issue by locating the data we required via the Texas Natural Resource information System (TNRIS).
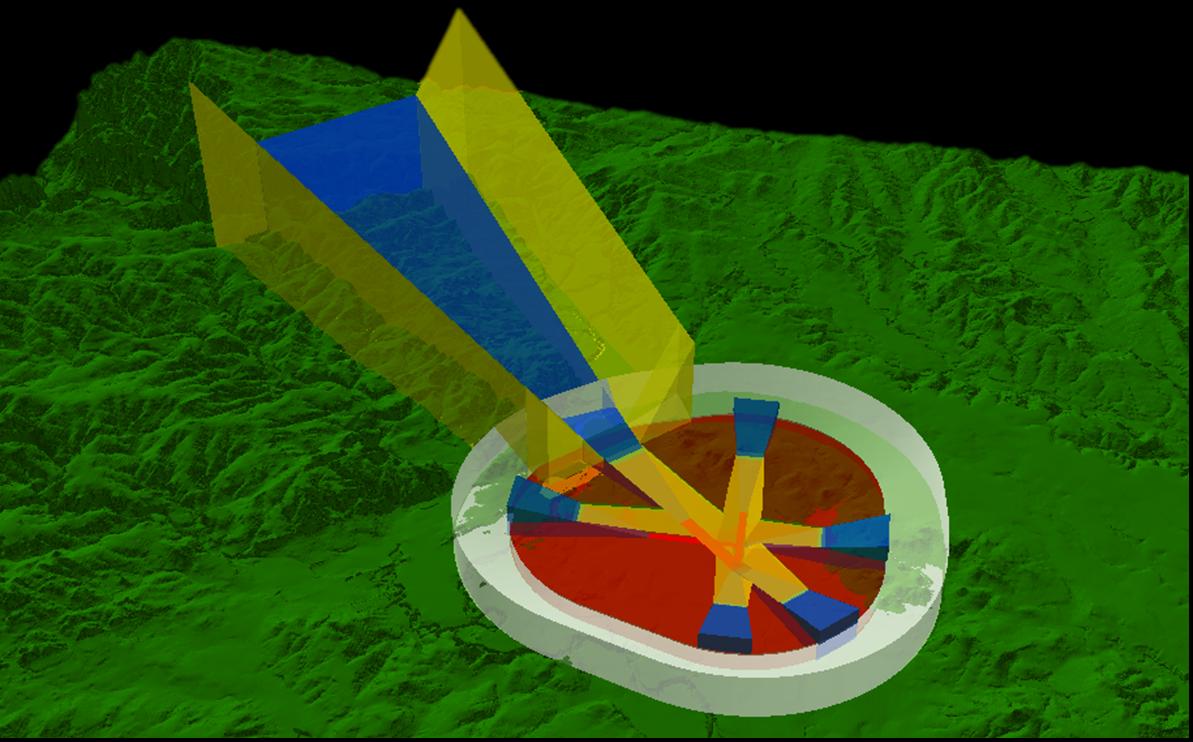
In order for the interactive mapping tool to display the maximum allowable height as we wanted, we had to go through several steps to accomplish this. We first imported the CAD files provided by TxDOT to the geodatabase. We then created polygons of each imaginary surface referencing the CAD files and following the regulations specified on the CFR, which gave us the end product of 2D polygons of the imaginary surfaces. Each imaginary surface has a different elevation, so Z values were added, making them 3D polygons. These polygons were then converted to TINs then to rasters. All the rasters were combined using cell statistics, giving us the result of a raster with the lowest surfaces. The difference was then calculated for the raster of lowest surfaces and our extent DEM. This gave us the maximum allowable height raster.
Penetrations
We created the penetrations layer to be included in the interactive mapping tool and allow users to see the penetrations within the hazard zones (under the imaginary surfaces) of the airport. We started our work with some data from a GIS survey conducted for the San Marcos Municipal Airport and some National Flight Data Center data for the state of Texas from 2012. After clipping those layers to our study area extent, we added information to each point’s attribute table about the ground elevation, the imaginary surface elevation, and each objects highest elevation.
Interact Mapping Tool
Our interactive mapping tool started out by importing the layers containing the necessary elements desired by our client into Manifold System. The next step in the process was to adjust the symbology to make the map user friendly. This included changing the roads and airspace contours to their respectable colors, by importing their color ramp off of ArcMap. After this was finished, I then went into the affected parcel attribute table and renamed columns to display their proper name. When this was finished, all unnecessary columns were hidden, to allow for a non-cluttered display when using the tool to find the highest/lowest maximum allowable building height. After completing this step, I then added a static reference area of the map in GIF format, that broken into 9 grid sections. Each grid will have a hyperlink that will link to the associated map when clicked. The last step was to export the final map product as a webpage to my local host web page. This will allow users to access the map from the internet and find their highest/lowest maximum allowable building height for their property.
Results
As a result of our work, our team was able to create a new hazard zoning map, specialize GIS layers, and an interactive map tool. We designed all of our deliverables with the general user in mind and ensured that our information would be easily understood while leaving the capability of more technical users to bring out the best in the data.
5.1 Hazard Zone Map
The first major task to complete for this project was an updated hazard zoning map. Our main concern was to ensure that the final product resembled the 1984 hazard zoning map and maintained its level of usefulness for planning. However, we also wanted this new map to be more understandable by general map users. As a result, we were able to produce an updated digital version of an airport hazard zoning map which is now flexible enough to be edited and used by engineers, planners, and other city officials alike.
5.2 Specialized GIS Layers
The second major task to complete for this project was to complete specialized GIS layers using ArcGIS 10.1. These layers include three-dimensional imaginary surfaces, maximum allowable height analysis layer, penetrations, and affected parcel
5.3 Interactive Mapping Tool
We were also able to create an interactive mapping tool using Manifold Systems that can be hosted via the web and made available to the general public as desired. This tool allows users to query information such as parcel ID’s, property ID’s, or full address. From that query the tool will provide information such as the range of maximum allowable heights for the selected parcel. This tool also allows users to use the info tool on the map to find the maximum allowable height at any point inside the imaginary surfaces at (10 meter resolution). For all other areas they will see a value of NA, which means that it falls outside of the imaginary surfaces and is not affected. Finally, users will be able to identify and find information for 127 penetrations through the imaginary surfaces. This interactive tool is broken down into a grid system which lets users choose the grid they are in and shows only a map for that grid. This reduces the loading time of each map and gives the user an easier extent to work with.
Discussions
6.1 Capabilities and Limitations
Use of ESRI ArcMap and ArcScene 10.1 produced great results for this project. We successfully made accurate GIS produces for the imaginary surfaces and maximum allowable height analysis layer using regulations describing their dimensions and CAD data as references. These layers were vital to our final interactive mapping tool product and we are confident in the results. One of the capabilities of GIS is the ability to edit of any of our layers to reflect future work or changes to the San Marcos Municipal Airport or imaginary surfaces.
One limitation that we encountered during the course of this project was the availability of high-resolution digital elevation models (DEM). Since civil airport imaginary surfaces and airspace regulation and protection are so important, we wanted to obtain data that would show as much detail as possible. Initially, our goal was to obtain 3 meter DEM’s for the planning study extent. However, for our area of study the best available DEM’s were in 10 meter resolution. At any rate, we fully believe that using 10 meter resolution DEM’s we were able to produce very accurate results.
We also encountered a limitation with our maximum allowable height layer. Initially, we planned on allowing users to query cells in a raster. Use of a raster would allow our data to be smaller and load faster. However, our interactive mapping tool could not handle data in this format so we ended up having to create a polygon fishnet for the same raster. These polygons in this fishnet would represent each raster cell. This meant that we ended up with a large vector layer with a good deal of information. The result works flawlessly and still provides users with the information we planned on delivering.
Another limitation we encountered had to do with the size of our data in the Interactive Mapping Tool. We later found out that since the scope of our project was too large for acceptable loading of our tool. We discovered that it took a considerable amount of time for the map to load. In order to make this easier for users, we decided to divide the study area into nine sections so the information could load faster. Besides having a faster loading time, users will not have to worry about whether the parcel they are querying is divided into two grids because the maximum and minimum allowable height will still be the same in both grids.
6.2 Similar Studies
We studied two projects from prior Texas State University GEO 4427 class groups. The first project we referenced focused on the New Braunfels airport conducted by Geo Solutions, Inc. From their project, we studied their methods of creating imaginary surfaces for airport zones, and we noted the software and techniques they used to develop and distribute their results. We also researched the web based map tool that they created as an example of an interactive tool for identifying airport hazard zones. We were able to glean many pros and cons of their design. The second project that we researched covered the San Marcos Municipal Airport conducted by Geo-Air Consulting. From this project we were able to observe how the methods they used to record obstructions, map imaginary surfaces, and discover penetrations. However, because that project also focused on planning for runway extensions we chose to use their data and results for reference purposes.
6.3 Future Projects
Now that we have constructed a new hazard zoning map, interactive mapping tool, and imaginary surfaces, there are many new options to explore in relation to the San Marcos Municipal Airport. For instance, analysis for the extension of the runways and new penetration analysis would be easy to conduct and entered into our interactive mapping tool. Runway extensions could give the San Marcos Municipal Airport great capacity to help assist cities like Austin and San Antonio with excess air traffic during large events. This would benefit the San Marcos airport greatly in terms of economic benefits. Future projects could also explore the expansion of an airport’s virtual flight school (Red Bird Skyport) in the area of San Marcos. This could also possibly attract more attention to the airport.
Conclusions
Our study was successful, and can be used for many other projects in the future because the data is all available in electronic format. If we were to do a project similar to this in the future, we would include a programmer in the budget to help with extra functionality for the mapping tool. Also, it would have been nice to have better data for the parcels layer from the city and county. Many of the parcels did not have addresses and the parcel polygons themselves overlapped.
Project Scope : San Marcos Airport, San Marcos, Texas