
Results
Findings
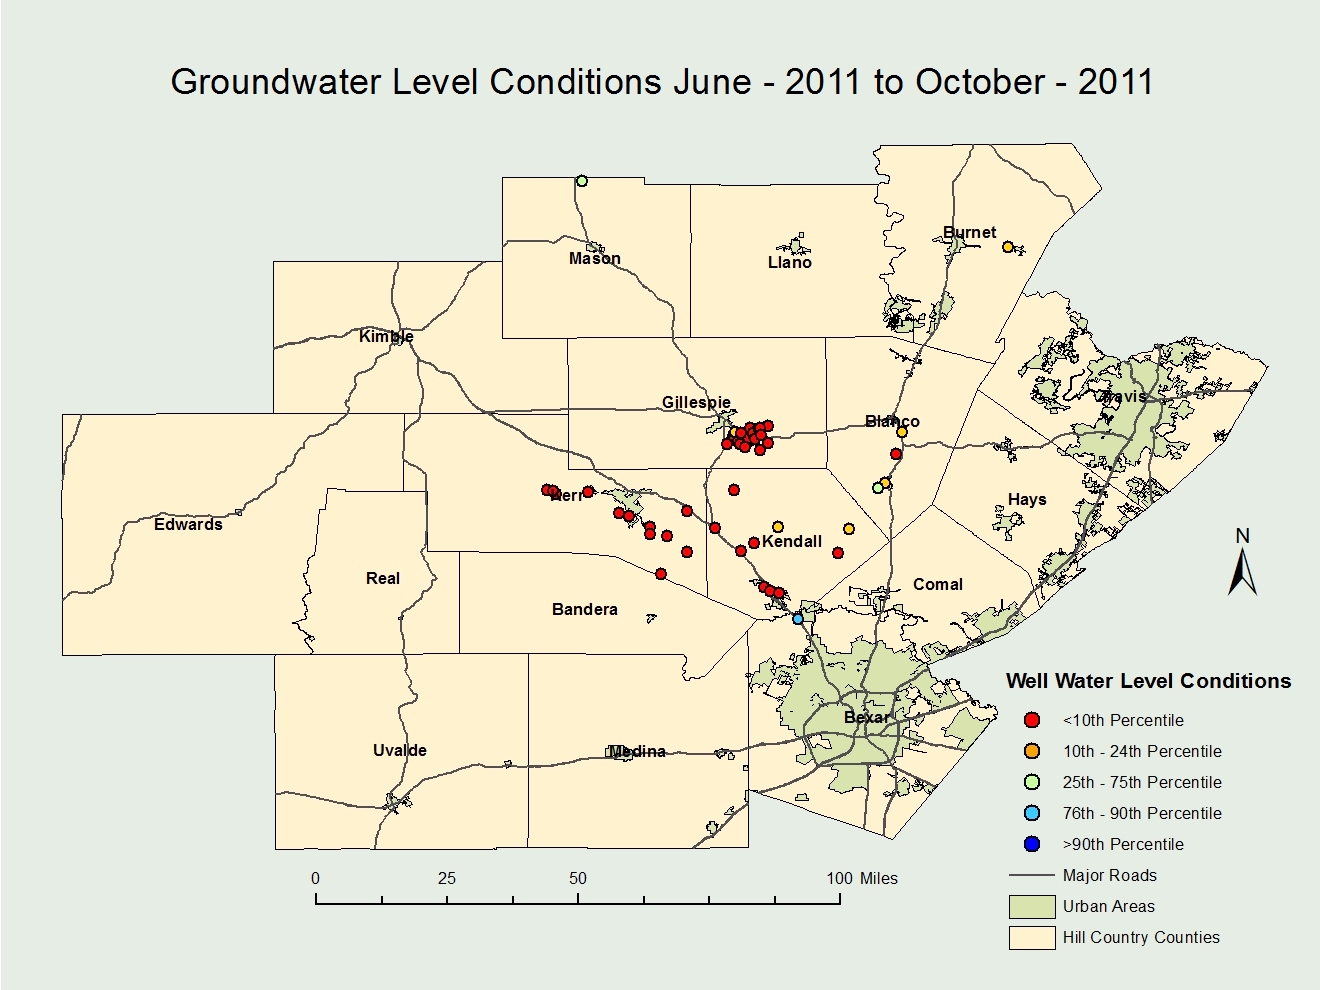
Out of over 400 well data collected, 59 met the criteria for our map product and out of 17 counties within the HCA study region, those wells are located in 7 (Figure 1). All but a few of the wells were at extremely low level conditions (.01 to 2 percentiles) for the months of June to October. There are no discernible patterns in the location of the four wells with the highest water elevation (more than 50 percentiles). Wells that qualify for the study are not distributed evenly throughout the geographic area because only four Hill Country GWDs record water levels on a monthly basis.
Classification of Well Water Level Conditions
The well water level conditions presented on our map product is classified with a set of percentile values. Wells that is in the 25th – 75th percentile classification is considered to be at normal conditions. In the attribute table (Figure 2), first row, it is recorded that the recent reading for that well is at the 83rd percentile. That value indicates that out of all the water elevation measurements recorded up until that point, the current water level conditions is above normal. Another way to interpret the first reading on the table is that out of a 100 percent of measurements taken for that well, only 17 percent of the water elevation measurements exceeded the current water elevation.
Texas State University - San Marcos, TX
Department of Geography - GEO 4427 Fall 2011
Instructor: Dr. Alberto Giordano
Lab Instructor: Ryan Schuermann