|
Summary Back to Top
In the United
States, Texas has suffered more than twice the number of flash flood
fatalities than the second-ranking state. A major contributor to
Texas’ dubious ranking is the fact that it is home to one of the largest
road systems in the nation, with numerous Low Water Crossings (LWCs)
responsible for the majority of flash flood fatalities. The
implementation of a statewide GIS for LWCs and Swift Water Rescues (SWRs)
to identify high risk areas will provide the International Flash
Flood Laboratory (IFFL), the Texas Flash Flood Coalition (TFFC), the Texas
Department of Health Services and other Texas agencies with a better
understanding of the relationship between the number and locations of these
sites and present spatial resources that can be used to prevent future
deaths and injuries related to flash floods.
Purpose Back to Top
Currently, no
known database exists containing LWCs in Texas, and the SWR records are
little more than lists of incidences. Elite Water Rescue Prevention
Consultants (EWRP Consultants) has created a GIS containing both documented
and potential LWC sites as well as SWRs reported in 2007. While it
has been an exercise in patience as information was converted from raw
information into spatial data, the foundation EWRP Consultants has built is
essential for achieving a way to answer the questions surrounding the fact
of Texas’ anomalously high number of flood-related fatalities. Now that
these elements are in the GIS, spatial and temporal correlations can be
made and more complex analysis can be done to build upon this foundation by
further elucidating connections and clarifying spatial relationships needed
by the IFFL and the TFFC.
Scope Back to Top
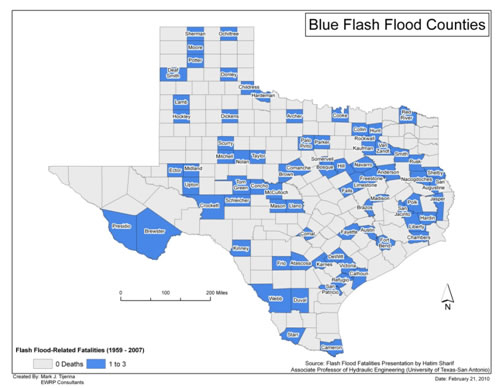
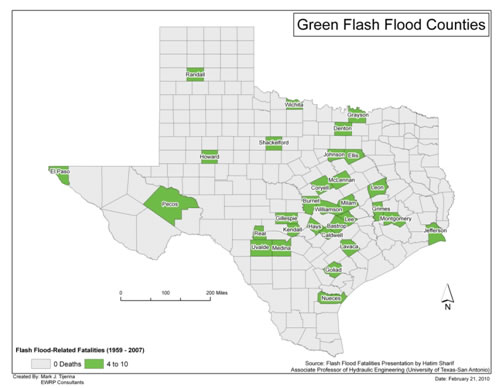
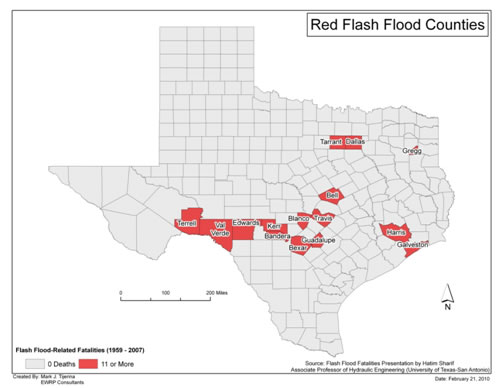
The SWR data
that the EWRP Consultants used to create the GIS is from 2007. The
TFFC shared research by Hatim Sharif which classifies Texas counties by
aggregate number of flash flood-related fatalities, shown in Figures
1-3. EWRP Consultants entered SWR and LWC data for the forty-four
counties within the proposed Flash Flood Alley, regardless of designation
by fatality, shown in Figure 4. The LWC analysis covers all the
counties in the proposed Flash Flood Alley for which FEMA floodplains are
available
Data Back to Top
Swift Water
Rescue
The data
utilized during the course of this project was collected from a variety of
sources. The primary Excel spreadsheet, which listed all of the Swift
Water Rescues, was obtained from the FEMA’s National Fire Incident
Reporting System. Much of the data that needed to be used for
locating SWRs on the map was available for each individual county and came
from Texas Natural Resource Information System (TNRIS), including Texas
transportation networks, FEMA floodplains and Strat Map Contours.
Detailed hydrography data was available from Environmental Systems Research
Institute (ESRI).
Low Water
Crossings
EWRP
Consultants successfully gathered data from four legal entities in
Texas. Hays County and Burleson Fire Department provided shapefiles
for LWCs in those areas. Marble Falls Fire Department sent a map and
Killeen Fire Department sent a list showing LWCs for which EWRP Consultants
used the same process and tools described above for SWRs to create
shapefiles.
- SWR
Excel Table:
- State Fire Marshall’s Office
- FEMA’s National Fire Incident Reporting System
- Priority
County Designations by Flash Flood-Related Fatalities:
- Created by Hatim Sharif of UTSA, using:
- National Climatic Data Center (NCDC) Storm Data
- Spatial Hazard Event and Loss Database (SHELDUS)
- Texas Department of State Health Services (DSHS)
- Shapefile of LWCs from Hays County
- Shapefile of LWCs from Burleson Fire Department
- Map and list of LWCs from Marble Falls Fire
Department
- List of LWCs from Killeen Fire Department
- Supporting
Shapefiles:
- TNRIS:
- Transportation by county
- Floodplains by county
- Strat Map Contours by quadrangle
- ESRI:
- Hydrology for North America, clipped to Texas
Methodology Back to Top
EWRP
Consultants split up 767 recorded SWRs from forty-four counties identified
as the proposed Flash Flood Alley. The goal was for each record in
the excel table to become a point in the GIS based on the address and
directions given in the reports written by fire departments that were used
to create the table. The base map used to place the points in the
correct locations was made up of an ESRI hydrography layer, county TNRIS
transportation layers, TNRIS Strat Map Contour lines and the Arc Server
world road map. Selecting the road name given in the excel
description by attribute from the TNRIS transportation layer was adequate
for many records, but most required reference to Yahoo maps and many had to
be tried with alternate spelling. Many numbered roads reported as
“FM” or “Hwy” were eventually located using an entirely different
prefix. Some records were made easier to locate by the directions
field from the excel table, which helped to zero in on the area of the
SWR. Once the target road had been identified, the next step was
using reasonable judgment to place the SWR point at the most likely area of
the road for the SWR to have occurred. Using the ESRI hydrography and
the TNRIS Strat Map Contour lines, EWRPC chose the segment of roads with
the lowest elevation for the placement of the SWR points.
Unfortunately, insufficient information was provided for some records and
these were marked as “Unable to Locate.”
Results
Back
to Top
EWRPC has
implemented a statewide GIS for SWRs and LWCs. This new GIS will
provide information to local governments and independent companies to help
them better understand LWCs and how they interact with SWRs. As part
of the process, EWRP Consultants did research in order to elucidate the
concept of a Flash Flood Alley. In none of the literature were
specific boundaries defined, so EWRP Consultants set the precedent by proposing
a forty-four county area of Central Texas along the Balcones
Escarpment.EWRP Consultants spent many hours analyzing the Swift Water
Rescue street locations reported and determining the best position on the
map to place these occurrences. This took careful consideration of
the spatial relationship between the roads, the elevation and the location
of the nearest body of water. As one would expect, the relationship
remained consistent throughout the state, with the Swift Water Rescue
occurring within a close proximity to the nearest river. There were a
small number of outliers: SWRs that seemed to have occurred in an area
where there is no body of water within miles. This is most likely due
to the fact that drainage occurs in places other than established streambeds
during short term high volume precipitation events. It will also be
helpful to the IFFL and the TFFC for future researchers to perform complex
analysis and clarify spatial relationships. EWRPC Consultants created
a shapefile containing 675 of the 767 SWRs in the forty-four counties
identified as the proposed Flash Flood Alley. This is an 88%
completion rate and provides the IFFL and the TFFC with tangible spatial
data to work with in the future. Maps showing the visual results of
the work done by ERWP Consultants can be viewed in Appendix 3. A KML
file is available for viewing the SWR locations on the EWRP Consultants
website.
Conclusion Back to Top
EWRP
Consultants has established a GIS for LWCs and 2007 SWRs that is the
foundation for the research and spatial analysis that the IFFL, the TFFC
and other Texas agencies desire to carry out with the intention of reducing
the number of flash flood-related injuries and deaths in the state of Texas.
Although time only allowed SWRs in the forty-four counties in the proposed
Flash Flood Alley to be completed, the precedent has been set and the ball
is in motion. The procedure developed for mapping SWRs is an
efficient and viable one, and EWRP Consultants recommend its use in the
future to map SWRs reported in other years. Targeting potential LWC
areas by the intersection method using ArcGIS is a reasonable way to begin
to represent these areas in a digital world, and there is room for future
researchers to refine the model and eliminate false positives. As
this foundation grows and the database becomes more complete, a wealth of
information is there for the taking using the powerful tool of GIS.
|