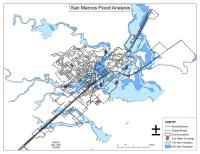
The 100 and 500 year floodplains, along with low water crossings within the city limits.
|
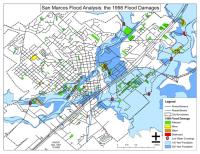
Reported 1998 flood damage. Damage severity ranges from Affected to Minor, Major, and at most Destroyed.
|
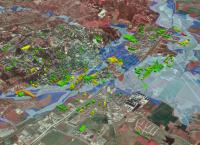
A 3D elevated perspective view of San Marcos, the floodplains, and the 1998 flood damage. The view is facing north.
|
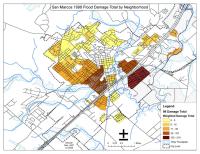
Total weighted 1998 flood damage by neighborhood.
|
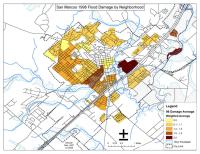
Average weighted 1998 flood damage by neighborhood.
|
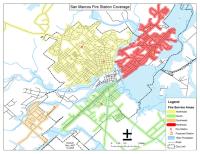
Fire station service areas in the event of a major flood. The northeast section (red) is lacking access to a fire station; we have proposed the addition of a fire station here.
|
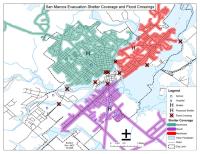
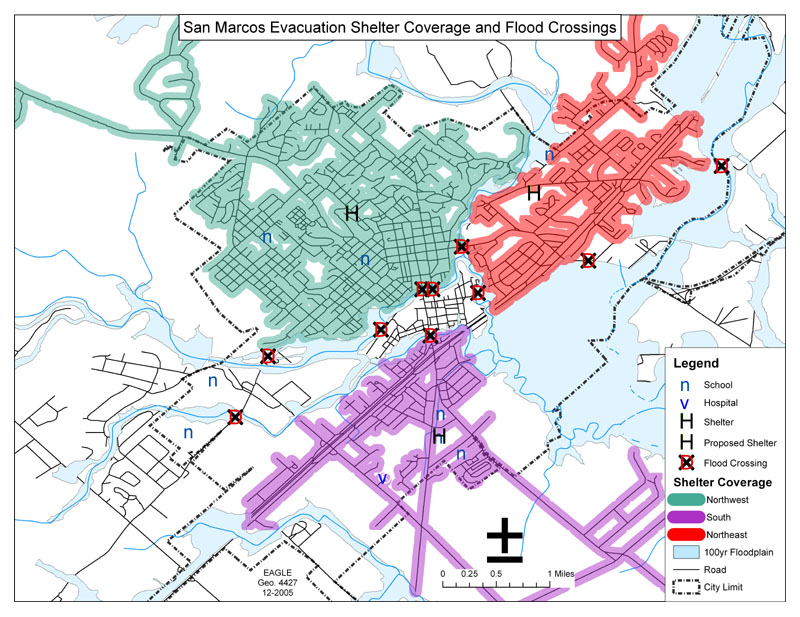
Evacuation shelter coverage during a major flood, based on the two suitable major 1998 flood evacuation locations. The northeast section of the city is lacking an evacuation center; we have proposed the use of Bobcat Stadium to service this area.
|
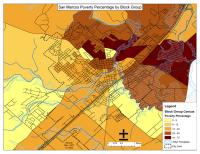
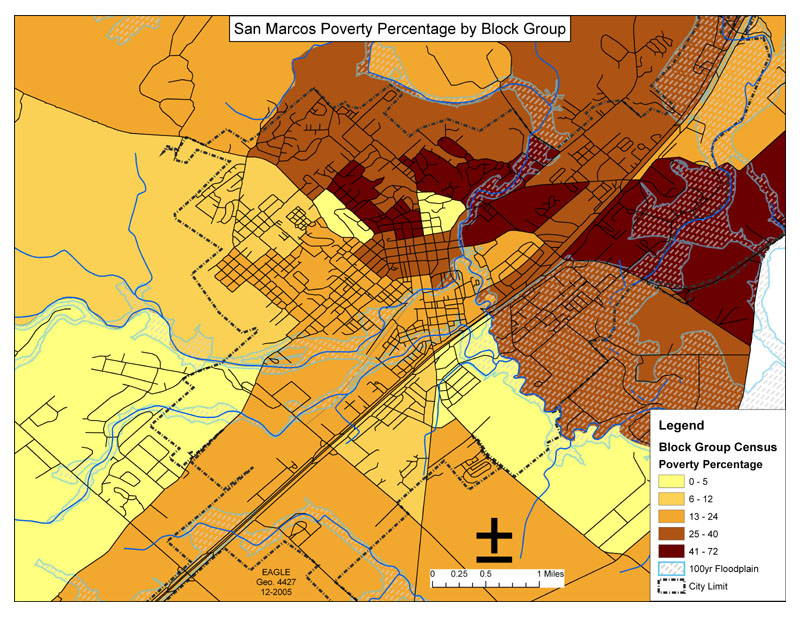
Percent of population in poverty, by census block group. There is some correlation between the lack of fire station and evacuation locations and the percentage living in poverty. A more conclusive analysis would require more detailed poverty statistics.
|
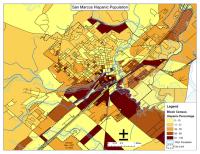
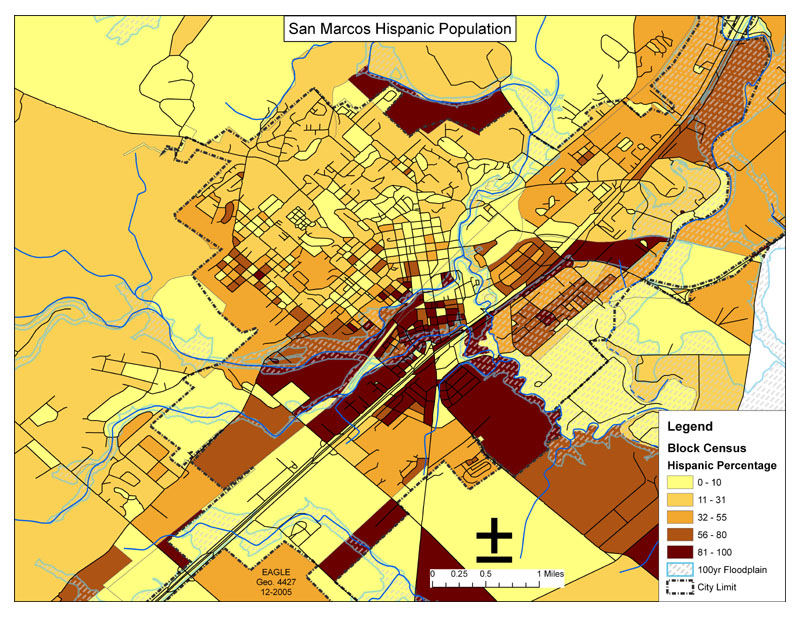
Hispanic population as a percentage of total population, by census block.
|
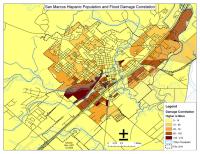
Correlation of Hispanic population and average 1998 flood damage. There are several areas that are both high in relative Hispanic population and average flood damage, potentially indicating that the Hispanic population lives in areas more prone to flood damage.
|
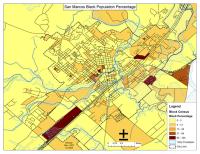
Black population as a percentage of total population, by census block.
|
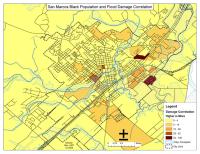
Correlation of black population and average 1998 flood damage.
|
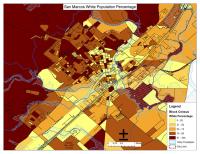
White population as a percentage of total population, by census block.
|
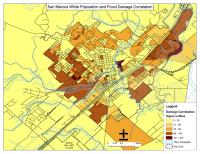
Correlation of white population and average 1998 flood damage.
|