
|
Project |
|
PURPOSE Preserving places of scenic value often results in conserving important natural areas as well as places of historical value. Since Hill Country Conservancy (HCC) and Hill Country Alliance (HCA) are interested in preserving the Texas Hill Country, our goal was to provide them with an inventory of potential scenic sites for further evaluation and potential future preservation. |
|
Home | Project | Maps | Documents | Contact Us |
|
Site Design by N.E.R.D.S. 2010 | Contact Webmaster |
|
RESULTS |
|
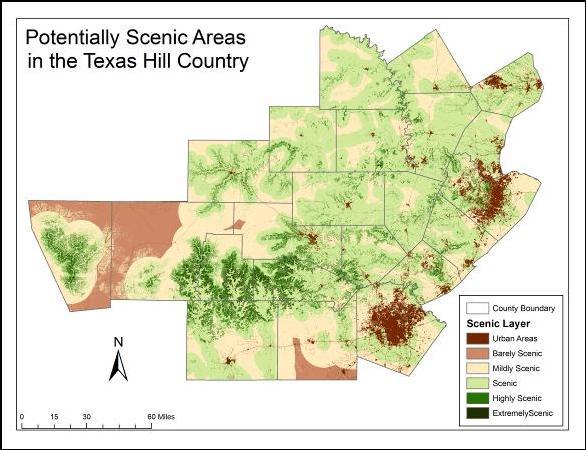
Figure 2. Greener areas represent more scenic locations while brown represents urban or less scenic. |
|
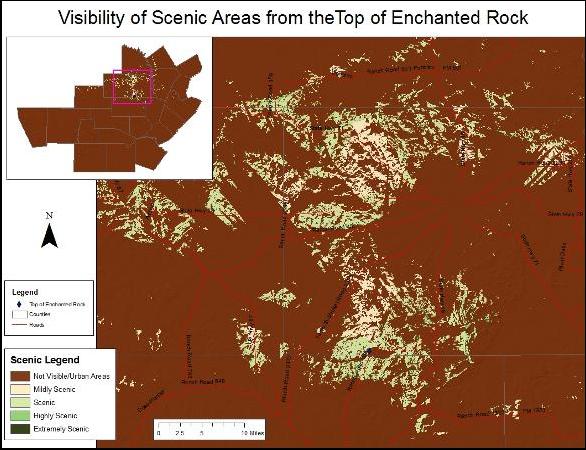
Figure 5. Greener areas represent more scenic locations that are visible from the top of Enchanted Rock while brown represents urban, non visible, or less scenic areas. |
|
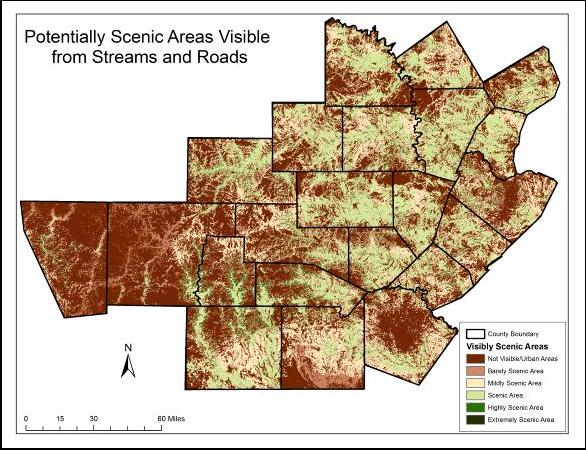
Figure 4. Greener areas represent more scenic locations that are visible from roads or waterways while brown represents urban, non visible, or less scenic locations. |
|
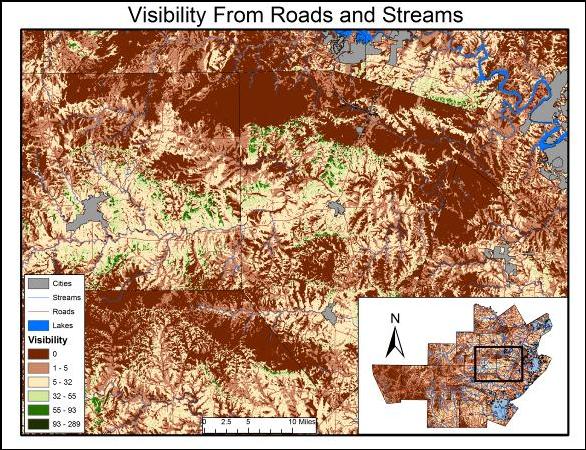
Figure 3. Greener areas represent locations that are visible from more points along roads or waterways while brown represents urban, non-visible, or less visible locations. |
|
CONCLUSION Most (82%) of the Texas Hill Country has some scenic value according to our scenic suitability model. In addition 29% of the Texas Hill Country is mildly scenic to scenic and 28% is Highly or extremely scenic, while only 43% is urban, not scenic, or barely scenic. Given the beauty of the Hill Country these results seem reasonable.
The roads and streams viewshed contains 52% visible cells and 48% not visible. When considering how many points can view each cell, 27% of the cells are viewable from 5 or less points with only 10% of the cells visible from only 1 point. In other words much of the Hill Country is visible from streams and roads with many cells visible from more than 1 point. |
|
Reference Bureau of Land Management. 2007. Manual 8410 – Visual Resource Inventory. http://www.blm.gov/nstc/VRM/8410a.html (last accessed 6 December 2010).
|
|
METHODOLOGY
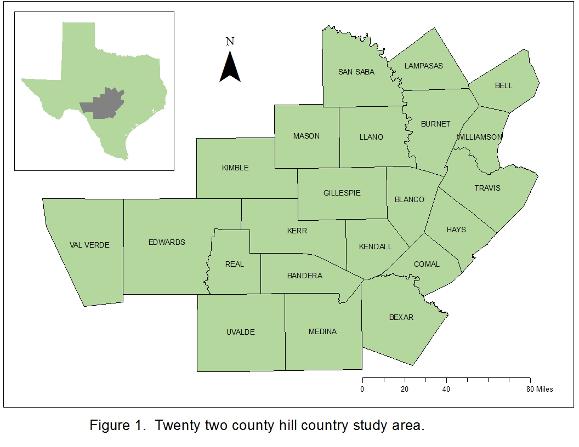
The study region covers a 22 county area located in the Texas hill country (Figure 1). Scenic areas generally have steep elevation changes, are often located near water, and are not usually urban areas (BLM 2007). We used these variables to identify scenic areas using GIS (Geographic Information System) to produce a scenic suitability model. This model produced a scenic score that ranged from “Urban” to “Extremely Scenic” (Figure 2). Since scenic sites are often viewed from roads or along waterways we also conducted viewshed analyses from both roads and water bodies. The viewshed analysis shows the locations of sites that are likely most visible while traveling along a road or river. We estimated viewsheds for each county within the study region by conducting viewshed analyses from a random number of points along the roads and waterways in each county. We then put all the counties into one map that combines both the roads and waterway viewsheds into a final visibility map that indicates sites of high or low visibility while traveling along roads or waterways (Figure 3). Next we took the visibility map and combined it with the original scenic suitability model to produce a map that estimates which scenic sites are likely visible from either roads or rivers (Figure 4). Finally, we used the scenic suitability model to identify sites of high scenic value (scored as extremely scenic) and did individual viewshed analyses of these sites to identify how visible these sites were from the surrounding area (Figure 5). |
|
Scenic Category |
Count |
% |
|
Urban/Not Scenic |
3477872 |
18 |
|
Barely Scenic |
4850833 |
25 |
|
Mildly Scenic |
1837488 |
10 |
|
Scenic |
3642420 |
19 |
|
Highly Scenic |
4514177 |
23 |
|
Extremely Scenic |
1005024 |
5 |